Today's Objectives
- Understand what an infographic is
- Consider the use of infographics in education
- Explore resources for creatig infographics
What is an infographic?
Information is Beautiful David McCandless' website
Definition, Usage and Popularity of Infographics from Specky Boy Design Magazine
Library Impact Study - Exhibit A
Library Impact Study - Exhibit B
Definition, Usage and Popularity of Infographics from Specky Boy Design Magazine
Library Impact Study - Exhibit A
Library Impact Study - Exhibit B
Gallery Analysis

Reflection Checkpoint: What are some important/effective component of infographics?
Why Infographics in Education?
TEKS Mini Tour
ELAR WRITING STRAND K-12
Students compose a variety of written texts with a clear controlling idea, coherent organization, and sufficient detail.
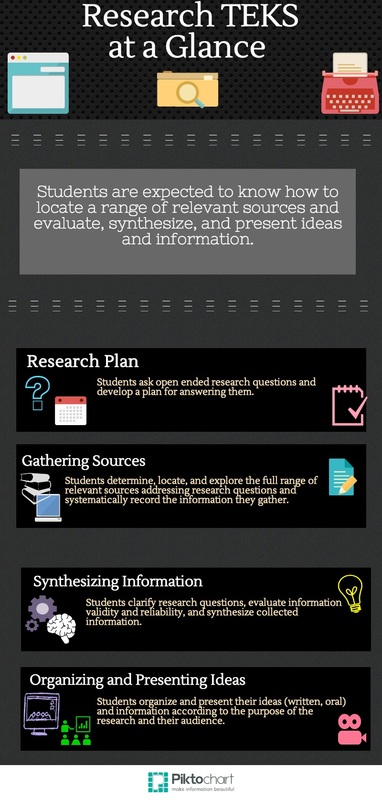
ELAR RESEARCH STRAND K-12
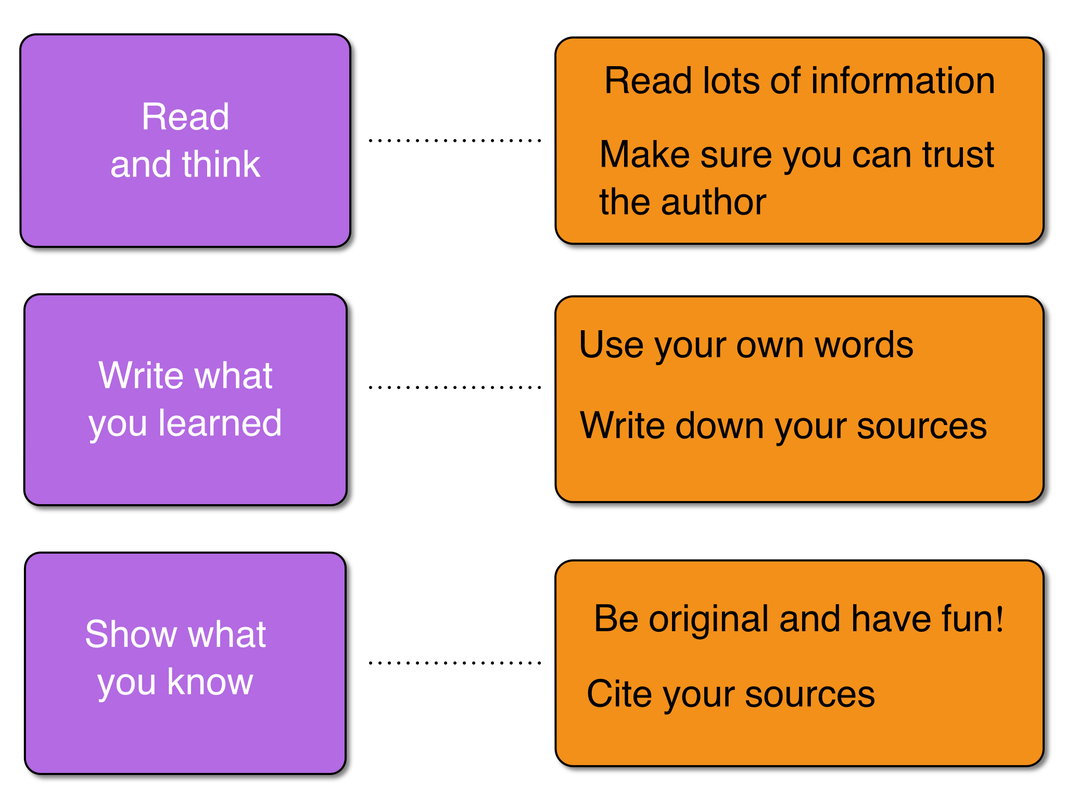
Students are expected to know how to locate a range of relevant sources and evaluate, synthesize, and present ideas and information.
ELAR MEDIA LITERACY TEKS K-12
Students use comprehension skills to analyze how words, images, graphics and sounds work together in various forms to impact meaning.
SOCIAL STUDIES TEKS K-12 (IN SOME FORM OR FASHION)
Analyze information by sequencing, categorizing, identifying cause and effect relationships, comparing, contrasting, finding the main idea, summarizing, making generalizations and predictions, drawing inferences and conclusions.
SCIENCE TEKS
MATH TEKS
Students compose a variety of written texts with a clear controlling idea, coherent organization, and sufficient detail.
ELAR RESEARCH STRAND K-12
Students are expected to know how to locate a range of relevant sources and evaluate, synthesize, and present ideas and information.
ELAR MEDIA LITERACY TEKS K-12
Students use comprehension skills to analyze how words, images, graphics and sounds work together in various forms to impact meaning.
SOCIAL STUDIES TEKS K-12 (IN SOME FORM OR FASHION)
Analyze information by sequencing, categorizing, identifying cause and effect relationships, comparing, contrasting, finding the main idea, summarizing, making generalizations and predictions, drawing inferences and conclusions.
SCIENCE TEKS
- K-2 Record and organize data using pictures, numbers and words
- 3.2C Construct maps, graphic organizers, simple tables, charts, and bar graphs using tools and current technology to organize, examine and evaluate measured data.
- 6.2 E Analyze data to formulate reasonable explanations, communicate valid conclusions supported by the data, and predict trends.
MATH TEKS
- Can infographics help support student understanding of math concepts?
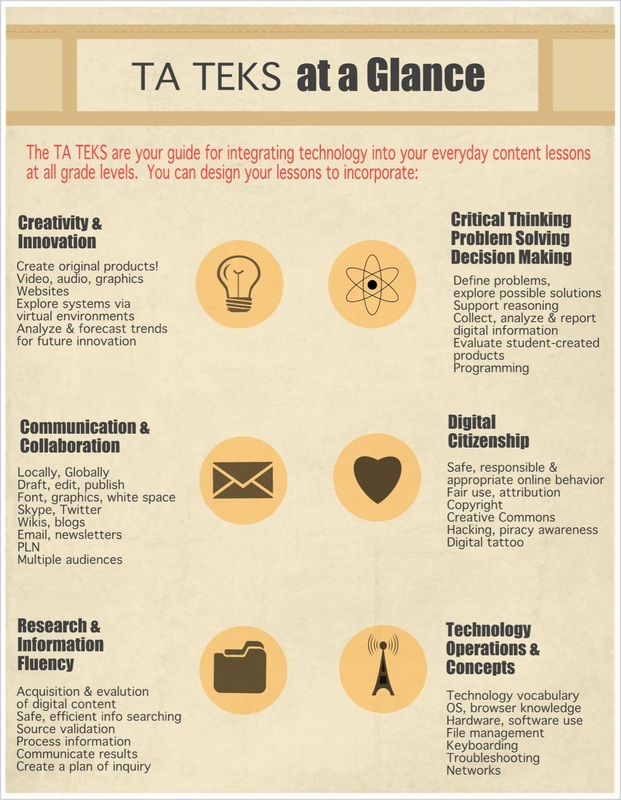
TECHNOLOGY APPLICATION TEKS
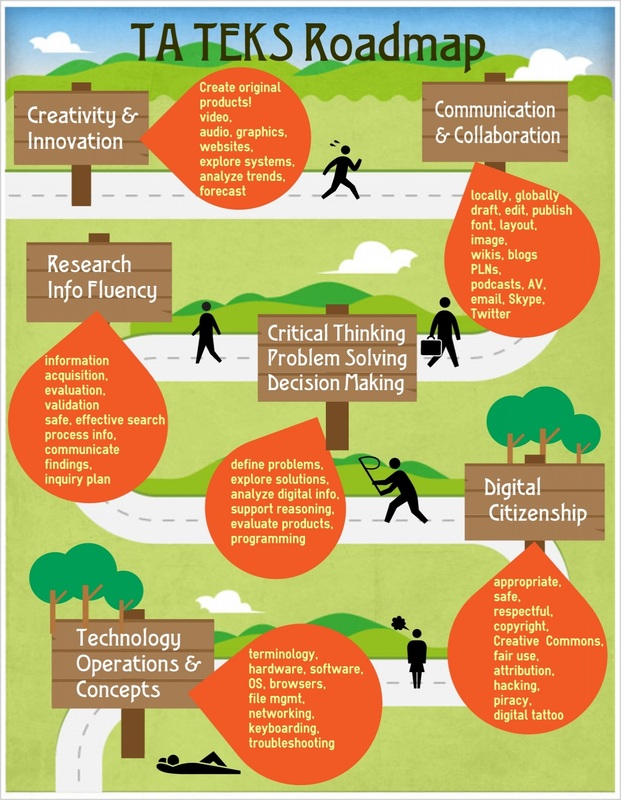
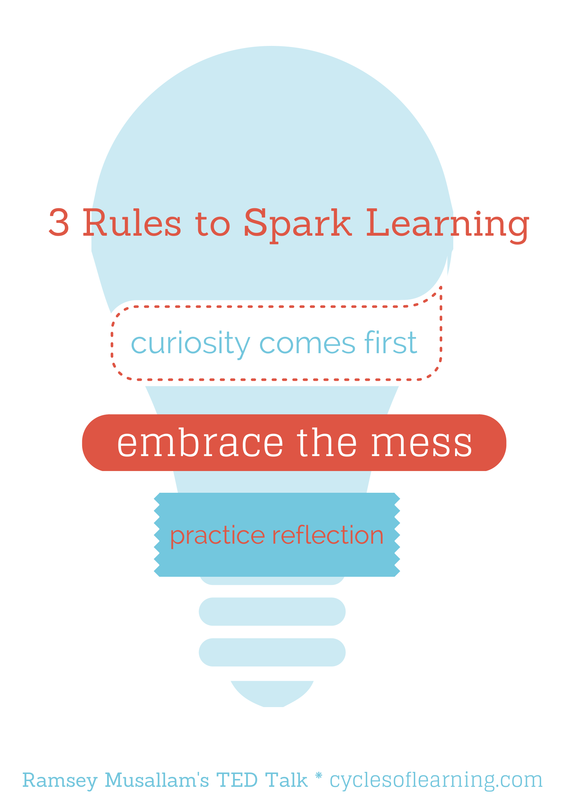
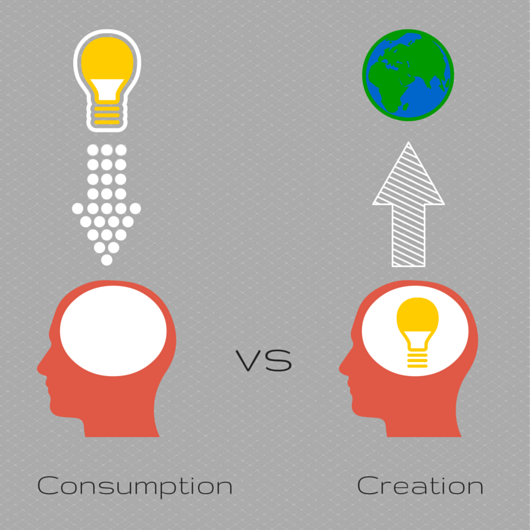
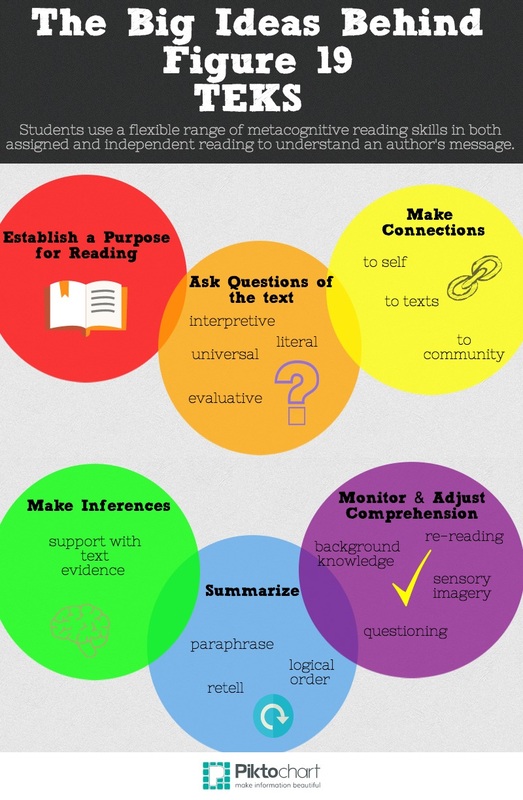
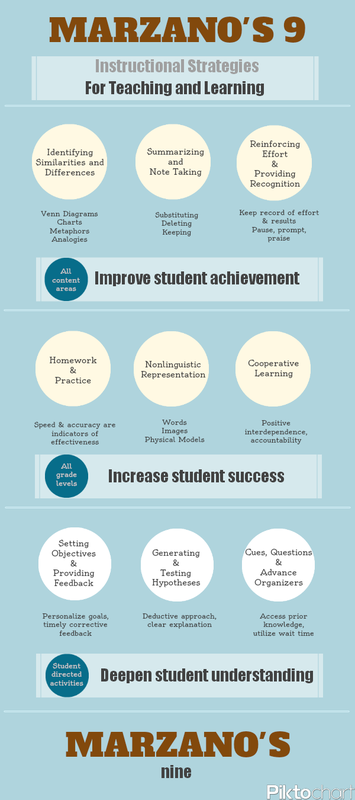
Explore: Classroom Examples

|

|

|
Make Your Own Standard & Strategy Connections

Reflection Checkpoint: What are you thinking now about infographics in education?
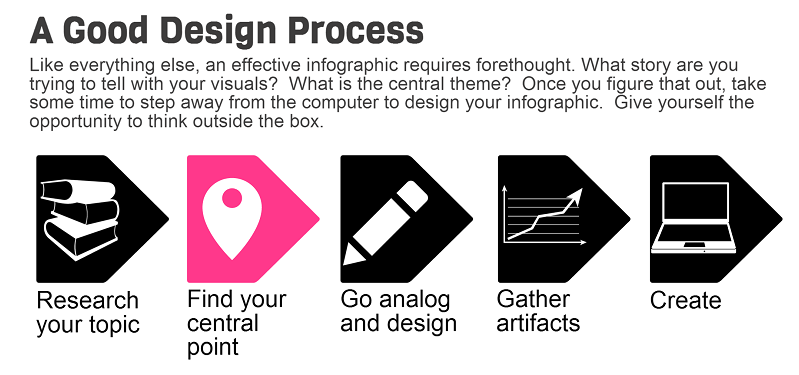
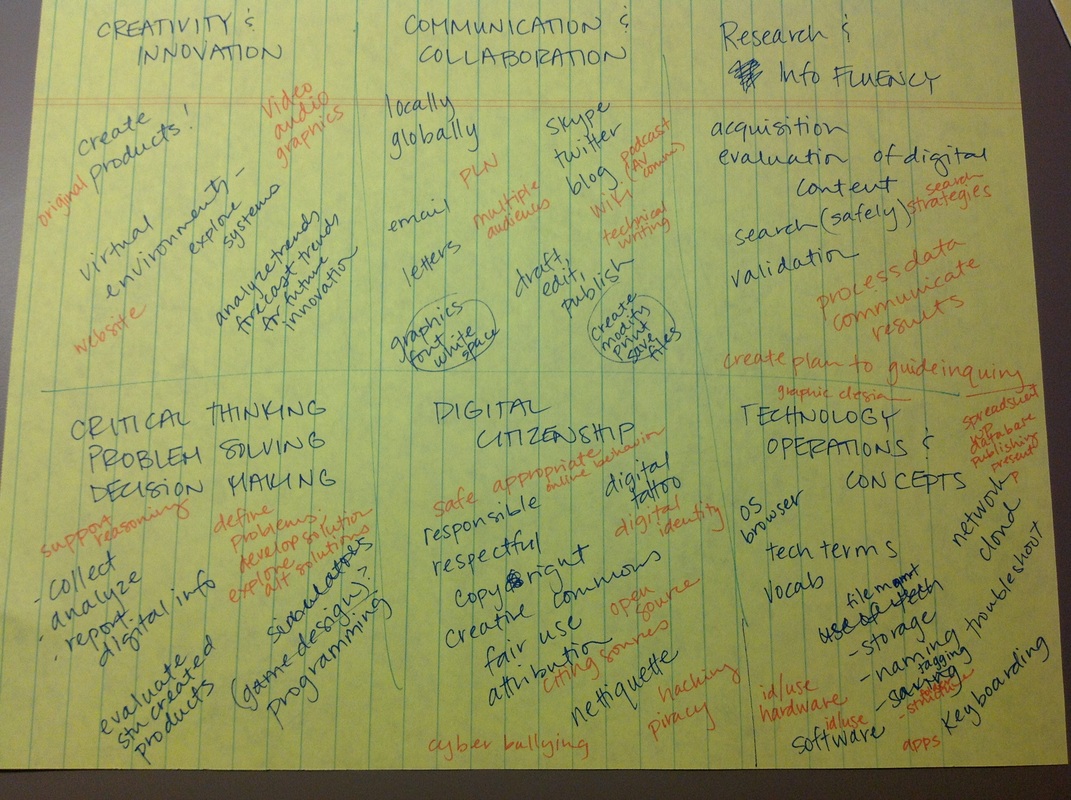
How do I do this?
EXPLORE TOOLS & RESOURCES
True infographic tools
Piktochart
Infogram
Easelly
Infographic-ish tools
Smore
ThinglinkEdu
Canva
Artifact Resources
Open Clip Art
The Noun Project
Pixabay
MorgueFile
Other Potentially Useful Stuff
A Primer on Infographics in the Classroom
Teaching with Infographics: Places to Start
Inventing Infographics: Visual Literacy Meets Written Content
Infographics in the Classroom
Infographic a Day
Creating Infographics with Students
Miss L's Whole Brain Teaching: Infographics
Room 233 Wikispace
Kathy Schrock's Infographics Page
THINK LOGISTICS
Where will students access the infographics you collect or create?
How will students "turn in" infographics they create?